Between Behar et al. 2012 and Johnson et al. 1983: The Mitochondrial DNA Tree Comes of Age but Remains a Blunt Tool for Human Evolutionary History
American Journal of Human Genetics, Volume 90, Issue 4, 675-684, 6 April 2012 doi:10.1016/j.ajhg.2012.03.002
A “Copernican” Reassessment of the Human Mitochondrial DNA Tree from its Root
Behar, Doron M., Mannis van Oven, Saharon Rosset, Mait Metspalu, Eva-Liis Loogvali, Nuno M. Silva, Toomas Kivisild, Antonio Torroni, and Richard Villems.
Mutational events along the human mtDNA phylogeny are traditionally identified relative to the revised Cambridge Reference Sequence, a contemporary European sequence published in 1981. This historical choice is a continuous source of inconsistencies, misinterpretations, and errors in medical, forensic, and population genetic studies. Here, after having refined the human mtDNA phylogeny to an unprecedented level by adding information from 8,216 modern mitogenomes, we propose switching the reference to a Reconstructed Sapiens Reference Sequence, which was identified by considering all available mitogenomes from Homo neanderthalensis. This “Copernican” reassessment of the human mtDNA tree from its deepest root should resolve previous problems and will have a substantial practical and educational influence on the scientific and public perception of human evolution by clarifying the core principles of common ancestry for extant descendants.
Link (Free Text PDF, free Supplemental Material)
Behar et al. reconstructed a human mtDNA root sequence, from which they claim all modern human sequences derive. They call it “Reconstructed Sapiens Reference Sequence” (RSRS) and they propose to replace the existing Cambridge Reference Sequence (rCRS) with this new one. The reason for this proposal is that rCRS, first published in 1981, comes from hg H (H2a2a1), which is a downstream clade. Scholars all along had to score mtDNA sequences either from derived-to-ancestral or from ancestral-to-derived states creating confusion and errors. Now this is all streamlined. Behar et al. collected a total of 18,843 complete mtDNA sequences of which 15,451 made it into the Phylotree’s latest mtDNA tree Build 14 (5 April 2012). The remaining 3,392 sequences have not been previously reported. The authors used Neandertal sequences to reconstruct RSRS. Apparently, all known Neanderthal sequences are fixed at the nucleotide positions (146, 182, 263, 1048, 3516, 4312, 5442, 6185, 9042, 9347, 10589, 10664, 10915, 11914, 12007, 12720, 13276, 16230) that are different between human L0 and L1’2’3’4’5’6 clades. Out of the 18 positions, L1’2’3’4’5’6 clade shares 10 with Neandertals and L0 shares 8.
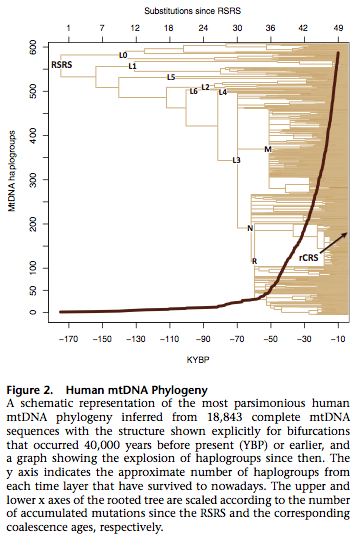
They used Soares’s corrected molecular clock and PAML software to estimated the ages of human mtDNA clades. The resulting tree of extant (survived) human sequences is shown below.
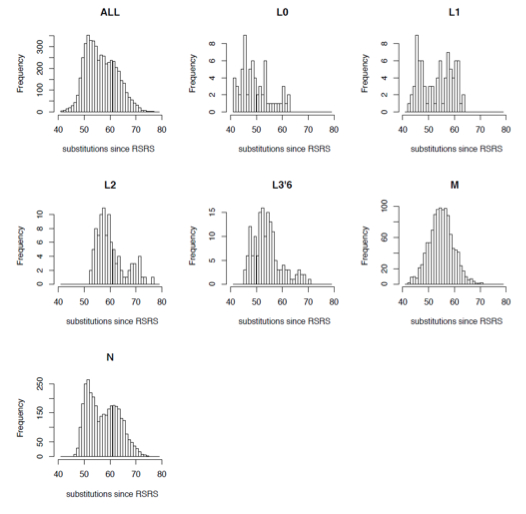
Behar et al. observed multiple violations of the molecular clock in the global data leading to vastly different numbers of substitutions in different lineages.
“Interestingly, the ranges of substitution counts within haplogroups M and N, which are hallmarks of the relatively recent out-of-Africa exodus of humans, are also very large. For example, within M there are two mitogenomes with 43 substitutions (in M30a and M44) and two mitogenomes with as many as 71 substitutions (in M2b1b and M7b3a). This is especially striking because the path from the RSRS to the root of M already contains 39 substitutions. Hence, the difference between the M root and its M44 descendant is only four substitutions (two in the coding region and two in the control region) as compared to 32 substitutions in the M2b1b and M7b3a mitogenomes.”
They depict (Suppl. Mat, S2) it as binomial distributions showing the range of branch-length variation around a mean. If the hypothesis of a molecular clock was true, we would’ve seen the vast majority of branches forming a tight cluster around the mean and having a moderate frequency.
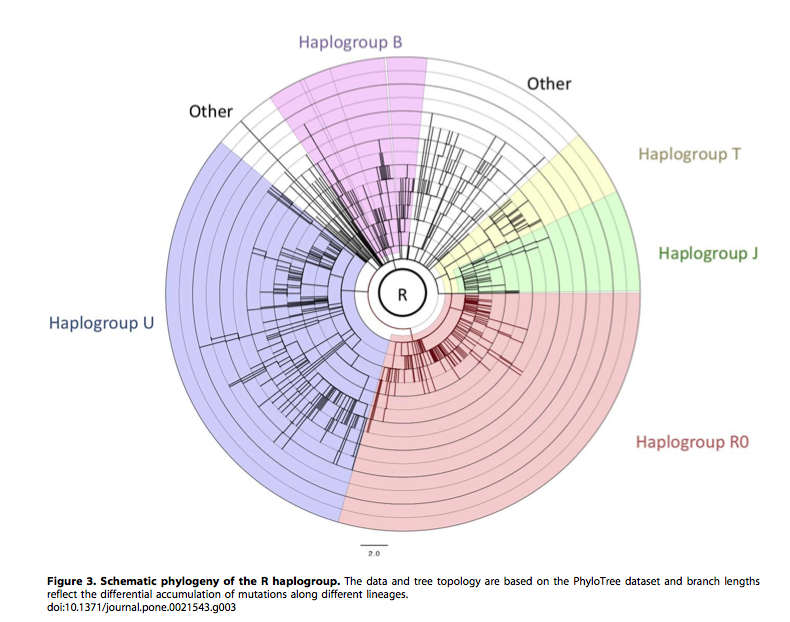
 Earlier, Pierron et al. (“Mutation Rate Switch inside Eurasian Mitochondrial Haplogroups: Impact of Selection and Consequences for Dating Settlement in Europe,” PLoS ONE 6 (6), 2011) made a similar observation regarding mtDNA R clade (see below). Some branches within a haplogroup have very many mutations, while others very few.
This is inconsistent with the molecular clock hypothesis that implies that mutations accumulate in different lineages at the same rate.
At this point, let’s take a step back to the dawn of mtDNA studies and revisit the very first mtDNA tree that was built by Johnson et al. (“Radiation of Human Mitochondria DNA Types Analyze by Restriction Endonuclease Cleavage Patterns,” J Mol Evol 19: 255-271) in 1983. While outstanding progress in mtDNA studies has been made since the early 1980s, some of the same patterns and challenges are still recognizable. Johnson et al. analyzed mitochondria from 200 individuals representing 5 populations (American Indians, Asians, Europeans, Bantu and Bushmen). They cut the molecules with 5 enzymes (Hpa I, Bam HI, Hae II, Msp I, Ava II) and discovered 32 different combinations of fragment patterns. The distribution of those mtDNA types were clearly different between human populations (see below).
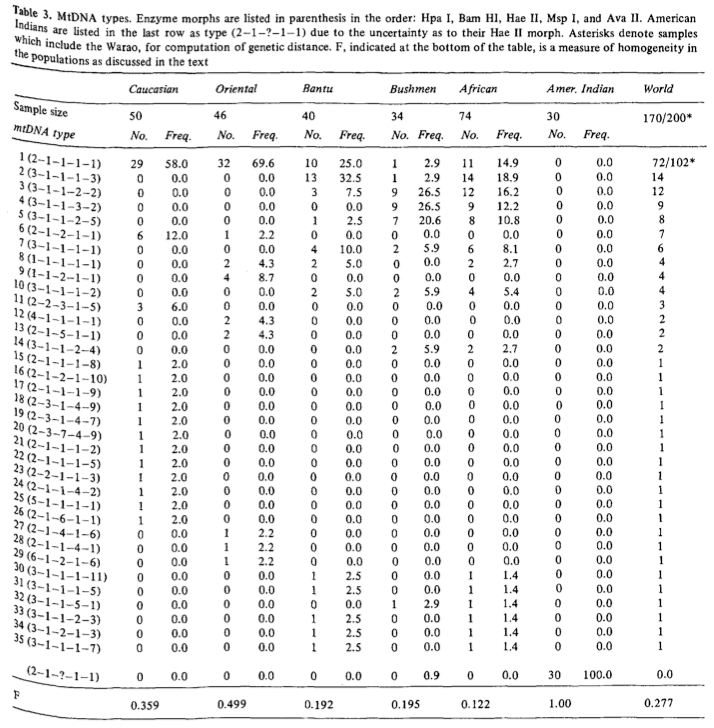 The American Indian population couldn’t be analyzed with Hae II because the sample was defective. Later it was confirmed (e.g., Excoffier L., A. Langaney. “Origin and Differentiation of Human Mitochondrial DNA,” Am J Hum Genet. 1989 44 (1): 73-85) that American Indians score “1” for Hae II and thus fall overwhelmingly into mtDNA type 1 (see below, the table is slightly shortened).
Johnson et al. constructed a parsimonious tree that arranged all the mtDNA types around the central type 1 (see below).
 Types 8 and 6 were also possible root types. American Indians had the highest frequency of type 1 and possessed types 8 and 6 as well. Types 1 progressively declined in frequency from the New World through Asia to Europe and, finally, Africa. Type 6 was not observed in Africa, while type 8 was not observed among Bushmen.
At the same time, African populations, and Bushmen in particular, showed the greatest genetic distances from other populations, while American Indians were the least divergent among all. Thirty years after the Johnson et al. paper we can still discern the similarities between their tree and the tree presented in Behar et al. 2012. Johnson et al.’s type 2 is now L2. In Johnson et al., Bushmen have vastly divergent mtDNA types such as 14 and 32 not observed in other populations. The same holds for hg L0.
Assuming the constancy of the molecular clock, Johnson et al. placed one possible root in Africa, while following the frequency of the central types in the phylogeny they placed another one outside of Africa (see below).
Once again, the tree topology in this early study is the same as in all subsequent mtDNA phylogenies, including Behar et al. 2012. There are several problems with Behar et al. 2012.
First, L0, L1, L2, L4, L5 are African-specific haplogroups, while we know from autosomal studies that it’s non-Africans (which are the carriers of a subset of L3 haplotypes, namely M and N) that are closer to Neandertals than Africans. The autosomal data is interpreted as evidence of a one-way, Neandertal-to-modern human admixture. Behar et al. don’t explicitly admit that African mtDNAs are closer to Neandertals than non-African mtDNAs, but it’s exactly what their data is saying. Between L0 and L1’2’3’4’5’6 Africans share all the 18 mutations at the nucleotide positions 146, 182, 263, 1048, 3516, 4312, 5442, 6185, 9042, 9347, 10589, 10664, 10915, 11914, 12007, 12720, 13276, 16230 found on Neandertal sequences, while non-Africans share only 10. And it’s in the context of a claim that’s being reiterated by all the genetic labs that Neandertal and modern human haploid genetics (mtDNA and Y-DNA) don’t show any evidence of admixture. It appears that the matches between Neandertal and African sequences in Behar et al. 2012 represent identity-by-state, not identity-by-descent.
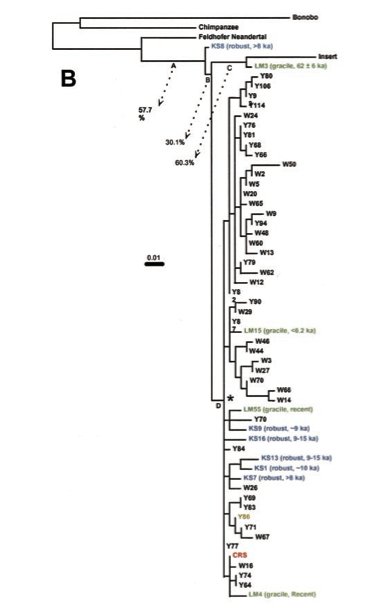
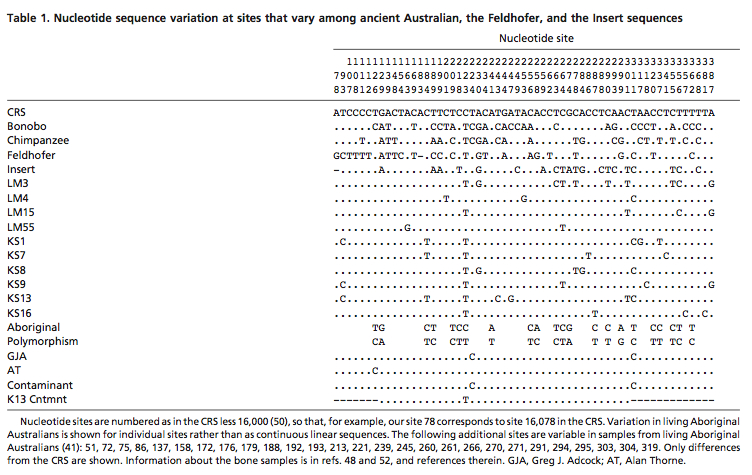
Second, Behar et al. claim (p. 679) that no mtDNA sequence has ever been reported that was more basal than the African L0 lineage. This is not true considering that 1) Australian Mungo Man sequence was reported (albeit without confirmation by an alternate genetic lab) as more divergent than any of the African sequences; 2) a 560-bp segment of human mtDNA D-loop embedded into the human nuclear genome and used to root the Mungo man sequence is more divergent than African sequences. Neither of the two are discussed by Behar et al. 2012. But it’s precisely a Mungo Man sequence (LM3) and the nuclear insert that appeared phylogenetically closer to the then-available Neandertal sequence (Feldhofer) than African sequences (see below, from Adcock et al. 2011).
Third, the dates for the divergence of the main human mtDNA clades obtained by Behar et al. 2012 make no sense from the point of view of the archaeological/paleontological record. First, the common mtDNA ancestor of modern humans is dated at 177,000 YBP, which makes African foragers diverge from the rest of humans more than 100,000 years before the emergence of systematic evidence of modern human behavior in the global archaeological record. This is clearly impossible, as it would mean the emergence of modern human behavior, culture and language twice, first among the Khoisans, then independently among all other modern humans. It also makes African humans look like sub-humans or “other” humans, which is hard to believe and is not consistent with their fully human culture and language. Second, L3 is dated at ~ 67,000 YBP, which is inconsistent with the 100,000 YBP date obtained for the Zhirendong mandible from South China with an unmistakable modern human chin. Additionally, there’s no archaeological evidence of an out-of-Africa migration around 70,000 YBP. There’s some evidence (see Comments on Dienekes) of an archaeological connection between East Africa and Arabia around 120,000 YBP (but not further between Arabia and India, etc.), which will mean that Behar et al.’s dates need to be doubled.
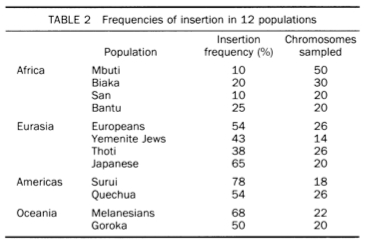
What has been ovcrlooked over the past 30 years is the possibility of an alternate root located, according to Johnson et al. (1983), outside of Africa somewhere in the midst of Asian, European and American Indian sequences. For a web-based discussion of possible arguments in favor (and against) of a “reversed mtDNA” tree, see Rokus Blog. An alternate root becomes a realistic possibility if it’s established that mtDNA evolution does not work in a molecular clockwork fashion. Pierron et al. 2011 and, now, Behar et al. 2012, suggest that molecular clock has been violated multiple times in human history. Since under an “alternate root” scenario American Indians appear the least removed from the root, it’d be good to be able to see if their mtDNA lineages show the same departure from the molecular clock constancy assumption, as, say, M, N and R clades. And it’s precisely among the non-African mtDNAs one should be looking for matches with Neandertal mtDNAs – be they of admixture or common descent origin. It’s notable that hgs M, N and R have a myriad of branches but only five of them are attested in the New World (2 in hg M, 2 in hg N and 1 in hg B). It’s been always puzzling why would proto-Amerindians cherry-pick just a couple of lineages from each and every clade found outside of Africa. (Comp. virtually all European mtDNAs belong to one single hg R.) Notably, the distribution of the “fossil” 560-bp segment of human mtDNA D-loop embedded into the human nuclear genome follows the worldwide distribution of Johnson et al.’s mtDNA type 1: highest frequencies were detected among American Indians (Surui and Quechua), followed by Melanesians, and lowest frequencies among Africans (Bushmen, Pygmies and Bantu) (see below, from Zischler et al. 1995), which casts further doubt on the African origin of modern humans.
Although Behar et al. 2012 made an important contribution to streamlining mtDNA nomenclature, there’s nothing “Copernican” about this contribution. In fact, times and again, mtDNA data proved to be full of inconsistencies and remains a dubious tool for evolutionary reconstructions. It’s regrettable that geneticists show zero reflective thinking and continue to maintain a “business-as-usual” attitude at a time when the complexity of interdisciplinary data begs for a more transparent, well-rounded and open-minded approach.



Thank-you. As a layman, I’ve been thinking this since it came out, comparing DNA research to my mental picture of my own family tree. Now that Neanderthal DNA is confirmed in non-African populations, despite zero (?) y-DNAor mtDNA neanderthal groups in modern sapiens-sapiens, it’s clear to me that absolute parsimony is not really the way to go in determining the truth of our genetic past. Some questions must stay unanswered, for a time, so that those too-soon-answered answers don’t become assumptions upon which errors are founded.