Data Visualization in Population Genetics: Admixture and Phylogeny
This is just a short note to reflect on the two principal ways of visualizing population genetic data: Circular and Linear. Both phylogenetic trees and admixture proportions can be visualized this way. See below some examples (I give no references because this is for illustrative purposes only).
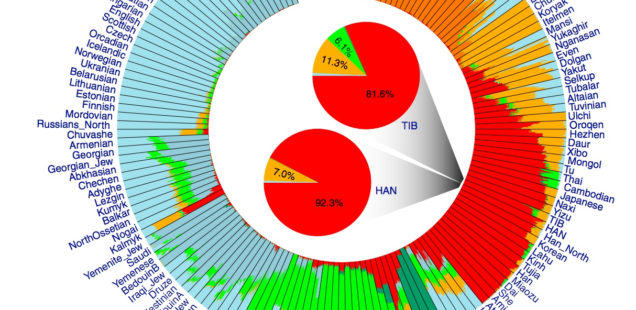
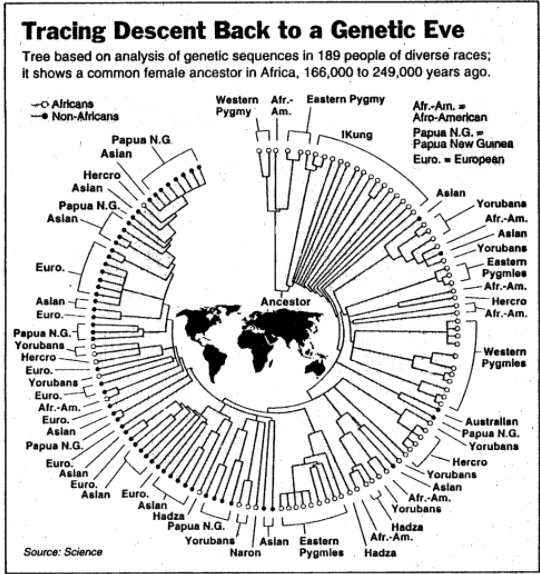
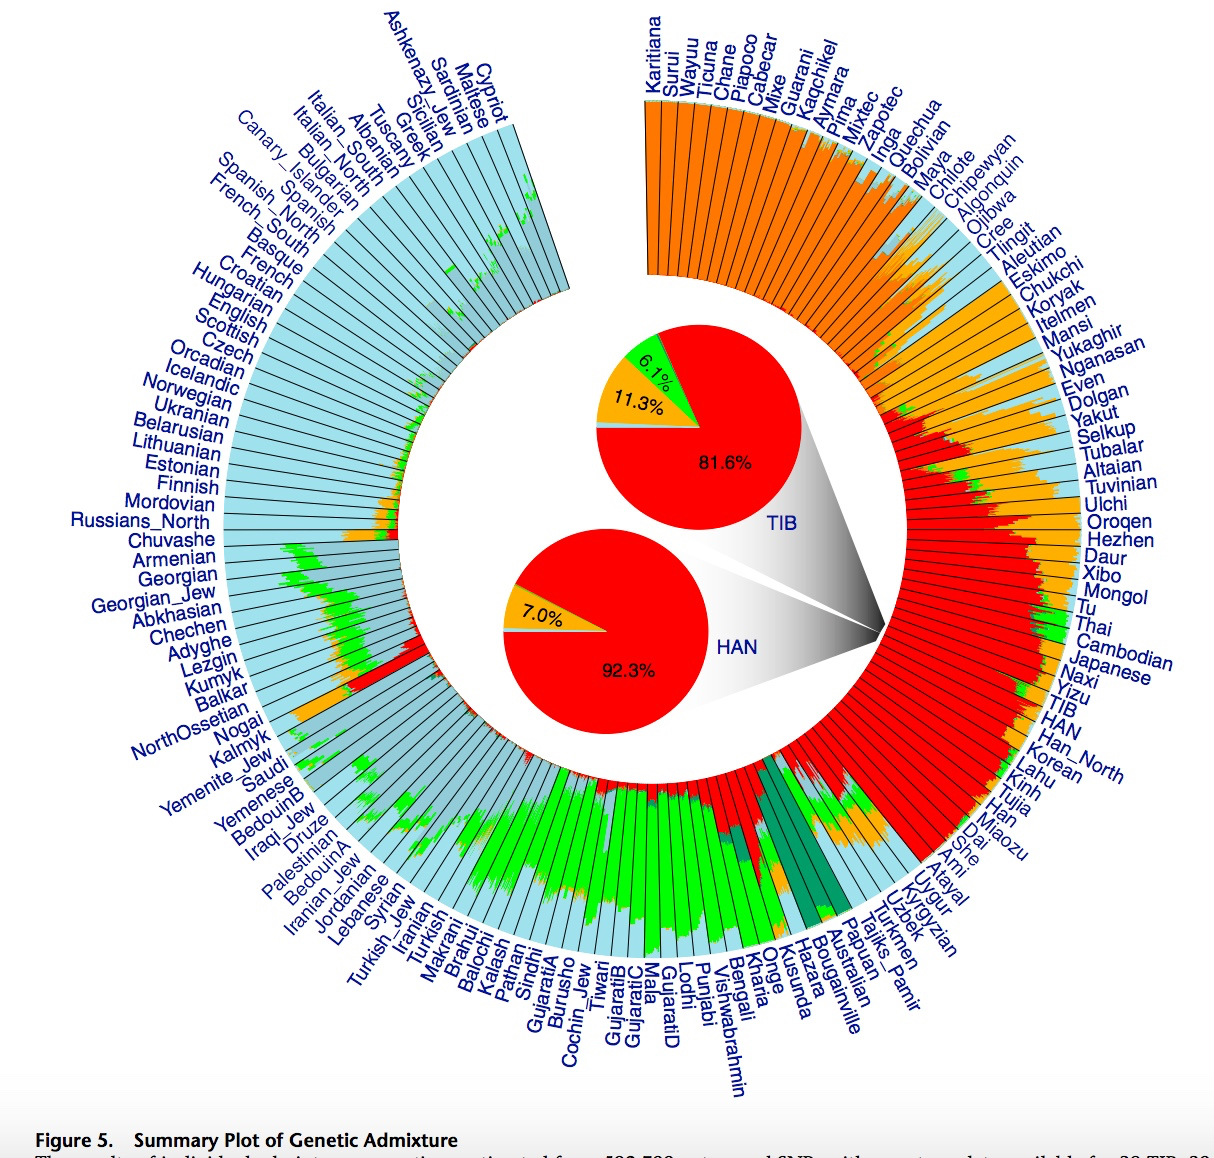
Circular
Linear
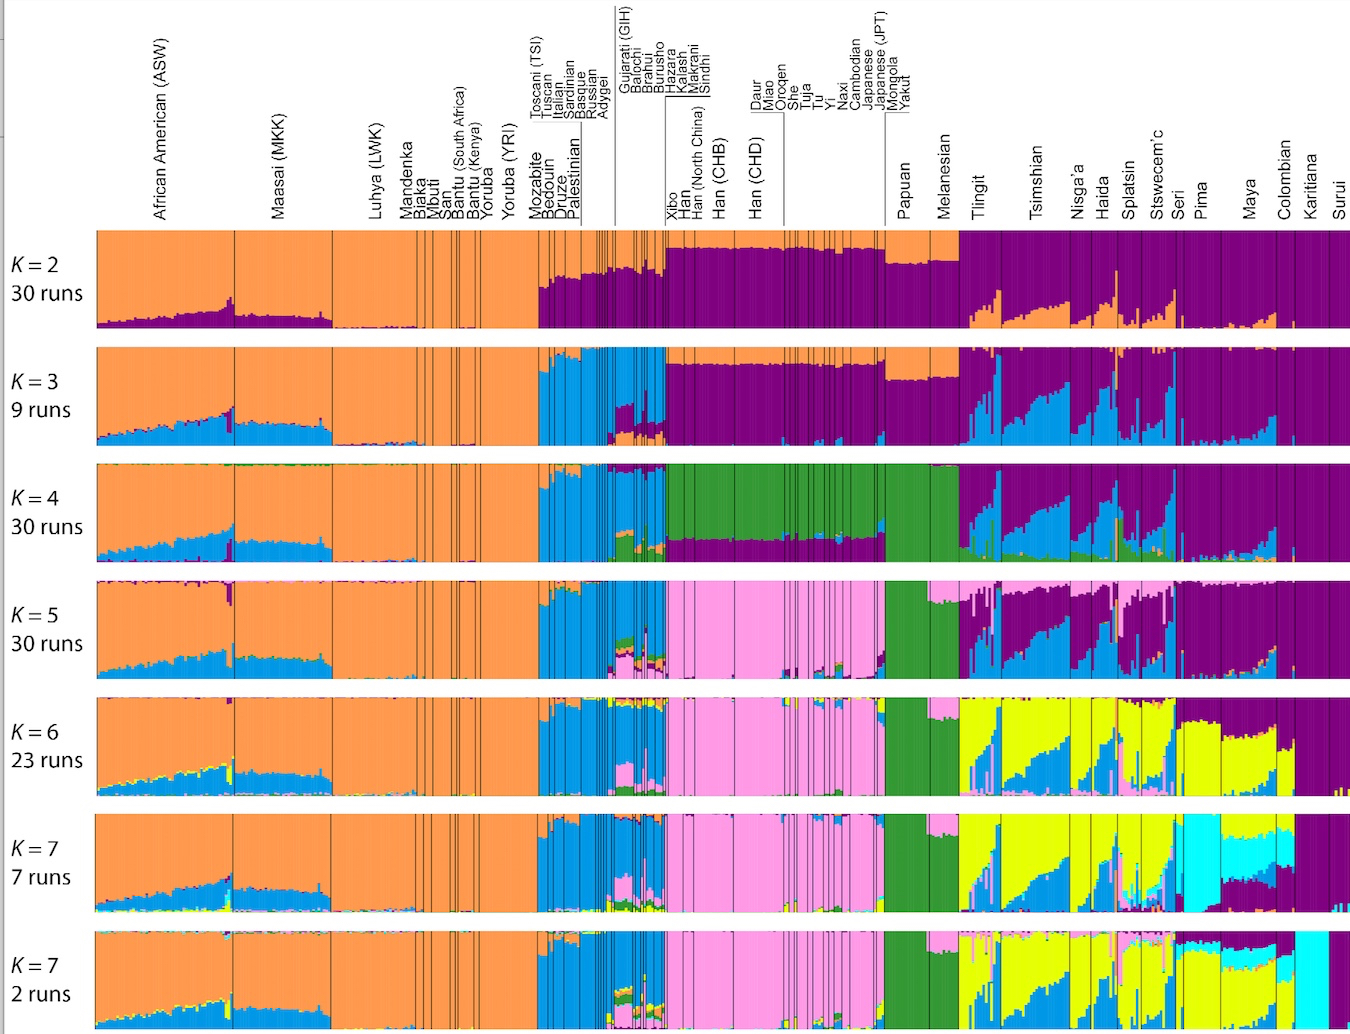
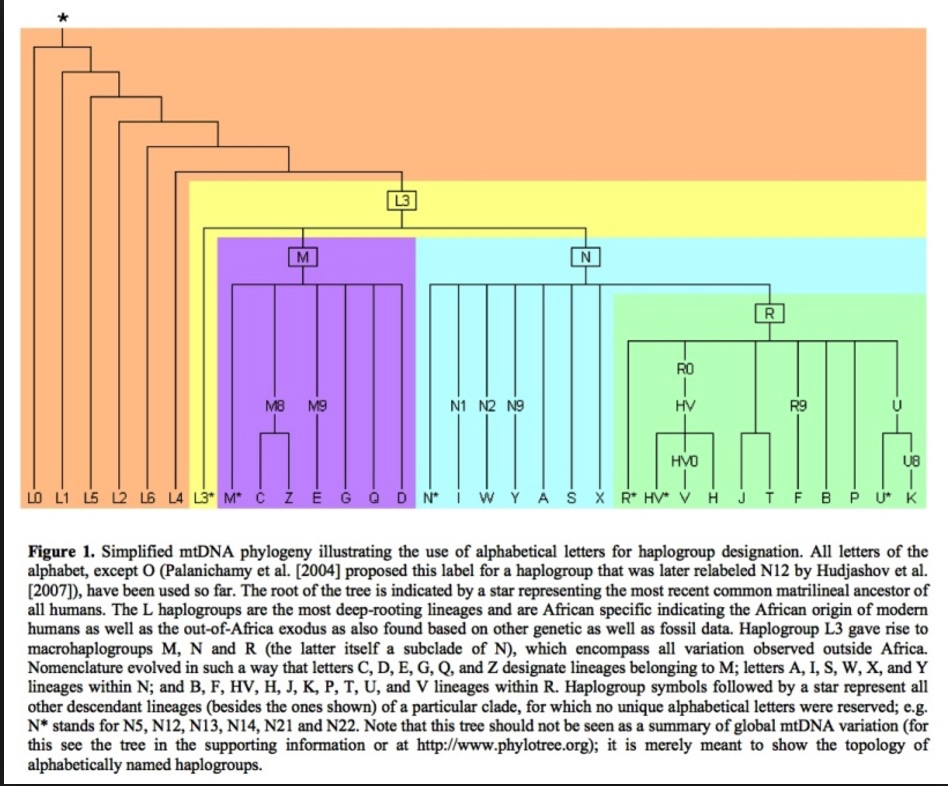
Both models display human genetic variation continuously between two extremes. In tree-like structures, Sub-Saharan Africans are displayed as a “basal” population. In admixture plots, human variation is simply bookended by Sub-Saharan Africans, on the one end, and Amerindians, on the other. In light of the fact that some genetic systems show Sub-Saharan Africans as dominated by derived alleles, and Amerindians dominated by ancestral alleles (see, e.g., here) – while the geographic apportionment of human variation remains the same – , I wonder if typical phylogenetic trees (Y-DNA or mtDNA) display only one – out-of-Africa – phylogenetic possibility and never another one – out-of-America.


Displaying data as tree-like when it includes multiple material admixtures between branches is more more problematic than a circular v. linear display.