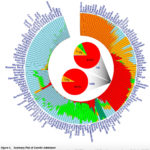
Data Visualization in Population Genetics: Admixture and Phylogeny
This is just a short note to reflect on the two principal ways of visualizing population genetic data: Circular and Linear. Both phylogenetic trees and admixture proportions can be visualized this way. See below some examples (I give no references…


Recent Comments