How Europeans Got to Be ~10% American Indian
Genetics doi: 10.1534/genetics.112.145037
Ancient Admixture in Human History
Nick Patterson, Priya Moorjani, Yontao Luo, Swapan Mallick, Nadin Rohland, Yiping Zhan, Teri Genschoreck, Teresa Webster, and David Reich
Population mixture is an important process in biology. We present a suite of methods for learning about population mixtures, implemented in a software package called ADMIXTOOLS, that support formal tests for whether mixture occurred, and make it possible to infer proportions and dates of mixture. We also describe the development of a new single nucleotide polymorphism (SNP) array consisting of 629,433 sites with clearly documented ascertainment that was specifically designed for population genetic analyses, and that we genotyped in 934 individuals from 53 diverse populations. To illustrate the methods, we give a number of examples where they provide new insights about the history of human admixture. The most striking finding is a clear signal of admixture into northern Europe, with one ancestral population related to present day Basques and Sardinians, and the other related to present day populations of northeast Asia and the Americas. This likely reflects a history of admixture between Neolithic migrants and the indigenous Mesolithic population of Europe, consistent with recent analyses of ancient bones from Sweden and the sequencing of the genome of the Tyrolean ‘Iceman’.
“We single out from Table 1 the score for French arising as an admixture of Karitiana, an indigenous population from Brazil, and Sardinians. The Z-score of -18.4 is unambiguously statistically significant….This was quite surprising to us, and in the remainder of the paper this is the effect we discuss.”
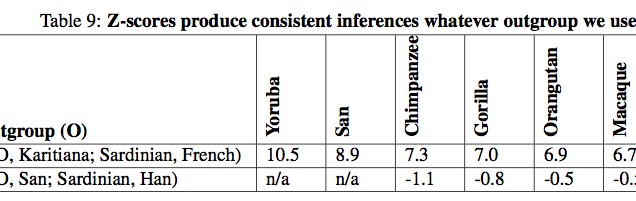
All European populations, to a varying degree, exhibit admixture from Karitiana but in Northern Europe the effect is stronger than in Southern Europe. The admixture also affected the populations of the Caucasus (Adygei). Some populations (Orcadian, Cyprus) evidently underwent genetic drift that caused the frequencies to drop (p. 83, Table 7). And the authors could have used any South or Central American Indian population to the same effect (p. 45). They did due diligence and collected Z scores on samples with 13 different ascertainments (Table 8) and 6 different outgroups (Table 9, which is incomplete without New World monkeys) but the results did not change.


There is no evidence in Patterson et al. (2012) of the presence of Karitiana-like ancestry in Sub-Saharan and northern Africa. Earlier studies using ADMIXTURE seem to have detected some of this ancestry in Yoruba. In STRUCTURE-type of runs (e.g., Rosenberg et al. 2002. “Genetic Structure of Human Populations”, 2002) an Amerindian component is visible at very low frequencies throughout Africa. Importantly, in Patterson et al. (2012), San Bushmen explicitly did not score any significant values with respect to Europeans. This means that among the two populations most geographically distant from Europeans, San Bushmen and Karitiana, it is a Karitiana-like population and a Bushmen-like population that contributed genes to Europeans. This also means that among the two populations usually portrayed as occupying the opposite positions in gene phylogenies, basal vs. terminal, it’s the purported “terminal” lineages that are found in Europe. Upon encountering the unexpected, Patterson et al. (2012) instantly assumed a defensive stance:
“We do not of course think that there has been substantial gene flow back into Europe from Amazonia. The only plausible explanation we can see for our signal of admixture into the French is that an ancient northern Eurasian population contributed genetic material both to the ancestral population of the Americas, and also to the ancestral population of northern Europe.”
But Patterson et al. did not find any northern Eurasian population that would have a higher admixture potential related to French than Karitiana. They reported similar, but still lower values for Naukan Eskimos and Chukchi.

So, properly speaking, the authors discovered “Amerindian” admixture in Northern Europeans but because of fear of coming across as light-minded, they decided to call it “Northeast Asian.” Science has definitely lost its steam over the past centuries. Imagine if, upon seeing the evidence of the earth’s triple motion, Copernicus would not have proceeded to write Commentariolus but instead concluded: “I do not of course think that the Earth can possibly rotate around the Sun.” This kind of safe judgment on the part of the astronomer would have likely stalled the evolution of scientific thinking in Europe by a couple of centuries.
Patterson et al.’s “shock” is also somewhat disingenuous because this “Amerindian admixture” was first reported 10 years ago by Rosenberg et al. (2002) (see below).

Earlier this year Joseph K. Pickrell and Jonathan K. Pritchard. (“Inference of Population Splits and Mixtures from Genome-wide Allele Frequency Data,” 2012, 16) arrived at the same result using TreeMix (see below).

They summarized all the inferred migrations in the following list, with Russians being a proxy for Europeans receiving admixture from migrating American Indians.

The “Amerindian admixture” in Europe is therefore not as new and shocking as Patterson et al. (2012) present it. But it may be getting traction across the genetic labs, so we may expect further elaborations, under different names, of the same finding.
Although Patterson et al. (2012) report that Northern Europeans are primarily affected by this Amerindian admixture, they acknowledge (p. 44-45) that Sardinians harbor the same admixture at lower frequencies:
“There is some modest level of sub-Saharan (probably west African-related) gene flow from Africa into Sardinia as is shown by analyses in MOORJANI et al. (2011), but no evidence for gene flow from the San (Bushmen) which is indeed historically most unlikely. But if we compute D(San, Karitiana; French, Sardinian) we obtain a value of −0.0178 and a Z-score of −18.1. Thus we have here gene flow ‘related’ to South America into mainland Europe to a greater extent than into Sardinia.”
And later (p. 48),
“We caution that if the Sardinians are themselves admixed with Asian ancestry although less so than other Europeans (a scenario we think is historically plausible), then we will have underestimated the Asian-related mixture proportion in Europeans.”
The paper leaves out the problem of known and accepted Amerindian admixture in Asia represented by mtDNA hgs A2 and C1 found in different parts of Siberia. With this Amerindian gene flow in mind, the need to be cautious regarding the Amerindian (rather than “Northern Asian”) contribution to the European gene pool disappears as we now have Amerindian “gene flow” present in Eastern (C1a in Altaians, Oroks, Ulchi, Nanaitcy and Japanese, see Tamm et al. “Beringian Standstill and Spread of Native American Founders,” PLoS ONE 2 (9), 2007: e829 and here), Western (A2) and Northern (A2) Siberia – the northern territories geographically connecting Europe with the New World via the Bering Strait. Notably, Hg C1 was also detected in Iceland. Ebeneserdottir et al. (“A New Subclade of mtDNA Haplogroup C1 Found in Icelanders: Evidence of Pre-Columbian Contact?” Am J Phys Anthropology 144 (1), 2011: 92-99) concluded
“Our results indicate a latest possible arrival date in Iceland of just prior to 1700 and a likely arrival date centuries earlier. Most surprisingly, we demonstrate that the Icelandic C1 lineage does not belong to any of the four known Native American (C1b, C1c, and C1d) or Asian (C1a) subclades of haplogroup C1. Rather, it is presently the only known member of a new subclade, C1e. While a Native American origin seems most likely for C1e, an Asian or European origin cannot be ruled out.”
The priority is again given to an American Indian source over an Asian source and since C1 is unknown in the Eskimos of Greenland, it’s unlikely to have come to Iceland recently via a western route. The “admixture effect” described by Patterson et al. (2012) for the whole genome may, therefore, have an exact parallel in haploid genetics.
Patterson et al. (2012) elaborates on a point raised in Reich et al. (2012):
“A complication in computing this statistic is that Native American, Siberian, and East Asian populations are not all equally genetically related to West Eurasian populations, as we can see empirically from 4 Population Tests of the proposed tree (Yoruba, (French, (East Asian, Native American))) failing dramatically whether the East Asian population is Han, Chukchi, Naukan and Koryak. The explanation for this is outside the scope of this study (it has to do with admixture events in Europe, as we explain in another paper in submission). In practice, however, it means that we cannot simply use a European population like French to represent West Eurasians in Equation S3.2, since if we do this, Equation S3.2 may have a non-zero value for a Native American population, even without recent European admixture. To address this complication, we took advantage of the fact that east/central Asian admixture has affected northern Europeans to a greater extent than Sardinians (in our separate manuscript in submission, we show that this is a result of the different amounts of central/east Asian-related gene flow into these groups). To quantify this, we computed the statistic f4(San, West Eurasian; Pop1, Pop2) for West Eurasian = Sardinian and West Eurasian = French, and for 24 Siberian and Native American populations (Pop1 and Pop2) (Figure S3.2). Figure S3.2 shows a scatterplot for all 190=20×19/2 possible pairs of these populations. Within non- Arctic Native populations, and within Arctic populations (East Greenland Inuit, Chukchi, Naukan and Koryak), the statistics are close to zero, consistent with their being (approximate) clades relative to West Eurasians. In contrast, there are deviations from zero when the comparisons are between non-Arctic Native and Arctic populations, with non-Arctic Native populations showing consistent evidence of being genetically closer to West Eurasians.”
What this means is that Karitiana-like autosomal admixture in Patterson et al. (2012) is the same as Reich’s autosomal “First American” component. This component is found in South, Central and North America, in the American Arctic and Subarctic populations as well as in Paleoasiatic populations on the Siberia side. Reich et al. agree that the presence of the First American component in Paleoasiatic populations represents a back-migration from the Americas. This explains well why the Chukchi and Naukan Z scores in Patterson et al. (2012) are lower than but close to the Karitiana scores. The European case should be no different. It’s also noteworthy that in both Europe and North America the “Amerindian,” or “First American” component is diluted by the “European” and “Asian” components. Around the Bering Strait, there are two separate Asian components found at increasing frequencies as one moves out of America. As I argued, it is illogical to postulate a founding migration to the Americas carrying the “First American” component, for which there is no evidence in Asia, followed by two more waves out of Asia, each one of which absorbing the “First American” component but then also passing it back to Paleoasiatic peoples. It’s much more parsimonious, especially in the light of Patterson et al. (2012), to envision a migration out of America bringing 1) the Amerindian component with deep roots in the southern areas of the New World to Asia and Europe and 2) Asian components with roots in the northern parts of North America.
Finally, it may be instructive to compare the autosomal evidence for the Amerindian component in Europe with some good, old blood group distribution maps.


Blood group O is highly frequent in the Americas and reaches fixation in South American Indian populations. It can be compared to the “First American” autosomal component as well as to Y-DNA hgs Q and C. Blood group A has moderate-to-high frequencies in Europe and in northern North America, with Northern Europe being a standout in Europe (just like in the proportion of Amerindian admixture!) and with Algic-speaking (it means autosomal-First-American-component-carrying) Blackfoot Indians having the world highest frequencies of blood group A. Blood group B is highly frequent in Asia but is absolutely absent in the Americas outside of the Eskimos. Whichever way one looks at it (from a late peopling of the Americas or from an out-of-America angle), hg B in Asia looks recent and endemic to Asia/Eskimos. Its distribution can be compared to Y-DNA hg O – highly frequent in Asia, absent in the Americas and in Australia.
The usual interpretation of the blood group distribution maps is that American Indians progressively lost A and B as they descended to South America. This scenario is very forced as it does not explain world-highest frequencies of blood group A in Blackfeet and very low frequencies of blood group B in Eskimos and its complete absence among North American Amerindians. In the light of Patterson et al. (2012), Reich et al. (2012), the mtDNA evidence for backflow from the Americas as well as the Denisova evidence for low intragroup allelic diversity in Mid-Pleistocene hominin isolates, it seems more likely that American Indians retain the originally high frequencies of blood group O, while blood groups A and B could be more recent mutations off of blood group O originating in northern North America and expanding from there to the Old World. It is highly symptomatic that the two Neandertals tested for blood group alleles showed blood group O (Lalueza-Fox et al. 2008. “Genetic Characterization of the ABO Blood Group in Neandertals,” BMC Evolutionary Biology 8: 342) confirming that the South American Indian blood group situation may be a Mid-Pleistocene hominin relic and not a recent dramatic departure from the current Siberian situation.
In this context, it is important to clarify the relationship between Amerindian admixture in Europeans and Neandertal admixture in non-Africans. In modern populations, the latter is manifested stronger in Asia and the New World than in Europe and (arguably) Africa. And the Amerindian component is stronger in Amerindians than in Asians (see also here). It remains to be seen if pre-Neolithic Europeans were more Neandertal than contemporary Europeans. If they were this correspondingly may make them even more American Indian.


Sir,
I think that O blood group is not relevant for kinship of populations. O blood high rate shows only isolation or genetic drift (or founder effect).
Sincerely yours.
I always suspected that these groups were related. And I know they will want to bury it under the rug and replace Amerindian with Northeast Asian due to historical occurances.
I am 23% Native American. My blood type is A+; my mother’s is O Negative. My daughter’s is O+.
I have wondered similar things as this guy:
[…] I wouldn't say this is just something that happens in the British. I'm sure you will find it in other European populations. You can read a bit about it in this blog. All populations have different proportions of ancestry. They even find an AmerIndian component in a lot of Northern Europeans. All these admixture events are quite ancient. Dienekes’ Anthropology Blog: Hints of East/Central Asian admixture in Northern Europe How Europeans Got to Be ~10% American Indian […]
This is all interesting; however, there was a Native American Slave trade that started in 1492 that took various Native Americans to Europe and Africa. The NA component could be a result of that. It seems that most geneticists, historians, anthropologists, etc want to overlook the impact of world-wide slavery regarding genetic make-up of the world’s populations. This information only confirms the destination and intermarriage of the two populations.
There is also evidence that Native American tribes such as the Iroquois and the Cherokee had R1B markers that match with populations from France (Silesia?), Basques and Southern Europeans. How is it not possible that there was not an Frozen oceanic plate for American populations to reach Europe during the Ice age or use as launching pads for boats? I have seen pictures of frozen oceanic plates in the Atlantic on Ice age maps, how can it not be possible that the Sami/Greenland populations be related to a movement from North America across the Atlantic?
An interesting thing is that every single modern human, regardless of tribal group or race has a innate genetic repugnance and repulsion towards Serpentes families (snakes) and Spiders (Arachnids)? This programmed fear of specific and unique order of animal species is too recent and coincidental to be discarded as irrelevant. The only scientific conclusion is that this familiarity with these specific species of animals coincided with the evolution of anatomically modern humans; therefore the origin of humans had to be in a continent where there was a high divergence and abundance of combative predatory serpents and arachnids in the opening episode of sapien evolution for such a recent genetic memory to encoded into the collective memories of human tribes.
Which continent would fall into these criterion’s to effectively imprint a recent genetic memory onto sapiens and which continent was warm enough during the Pleistocene to house a large array and diversity of serpentes and arachnid families to imbibe such a memory onto sapiens in evolutionary terms, in which this diversity of predatory serpents and arachnids last to this day?
The American or the South American continent of course. What was the diversity of species in South America during the late Pliestoscene and the environment/terrain there? Early Sapiens would in such a scenario, have evolved in South America and then traveled across a Central American corridor where they followed elephantae species such as gomphotheres onto North America and met Bison Latifrons, stag-moose, Castoroides, future Woolly mammoths, Woolly Rhinoceras etc.
How is it by coincidence that there are European and North America Mooses, Eurasian and North American beaver populations, Elephantae reported in China and Rhinoceras populations in places such as Indonesia, South East Asia and Africa? These species had to have been descended from animals migrating across ice plates and ice free corridors towards different environments, and human movements and activity had to have influenced the backwards migrations of such animals from the America’s onto Europe. These creatures had to have evolved and originated in North America to walk and spread out onto the old world which coincides and further adds support of a human migration from the America’s to the old world.