Data Visualization in Population Genetics: Admixture and Phylogeny
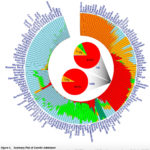
This is just a short note to reflect on the two principal ways of visualizing population genetic data: Circular and Linear. Both phylogenetic trees and admixture proportions can be visualized this way. See below some examples (I give no references…

Clicks and Genes: Linguistic and Genetic Perspectives on Khoisan Prehistory
Science DOI: 10.1126/science.1227721 Genomic Variation in Seven Khoe-San Groups Reveals Adaptation and Complex African History Carina M. Schlebusch, Pontus Skoglund, Per Sjödin, Lucie M. Gattepaille, Dena Hernandez, Flora Jay, Sen Li, Michael De Jongh, Andrew Singleton, Michael G. B. Blum,…


Recent Comments