Ancient DNA from Mal’ta and Afontova Gora: A Full Account
Courtesy Alexander Kim, the long-awaited paper by the Eske Willerslev team became finally available to me. This is obviously not the last word on the subject of Amerindian origins, and the David Reich Lab has a different interpretation of ancient and modern DNA data, which is more consistent with an Amerindian-like admixture in West Eurasians. But Raghavan et al. 2013 is a fascinating end-of-the-year read that shows once again that science is like wine: it gets only better with age.
Upper Palaeolithic Siberian Genome Reveals Dual Ancestry of Native Americans
Maanasa Raghavan, Pontus Skoglund, Kelly E. Graf, Mait Metspalu, Anders Albrechtsen, Ida Moltke, Simon Rasmussen, Thomas W. Stafford Jr., Ludovic Orlando, Ene Metspalu, Monika Karmin, Kristiina Tambets, Siiri Rootsi, Reedik Magi, Paula F. Campos, Elena Balanovska, Oleg Balanovsky, Elza Khusnutdinova, Sergey Litvinov, Ludmila P. Osipova, Sardana A. Fedorova, Mikhail I. Voevoda, Michael DeGiorgio, Thomas Sicheritz-Ponten, Søren Brunak, Svetlana Demeshchenko, Toomas Kivisild, Richard Villems, Rasmus Nielsen, Mattias Jakobsson and Eske Willerslev.
Abstract
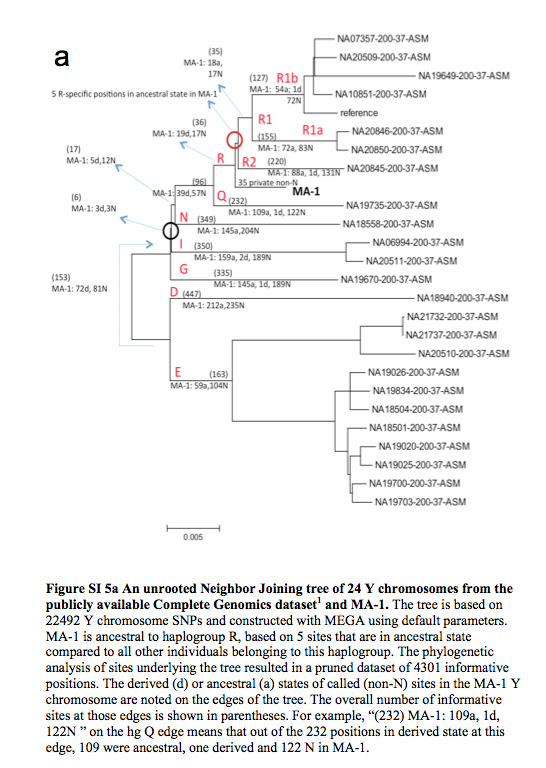
The origins of the First Americans remain contentious. Although Native Americans seem to be genetically most closely related to east Asians, there is no consensus with regard to which specific Old World populations they are closest to. Here we sequence the draft genome of an approximately 24,000-year-old individual (MA-1), from Mal’ta in south-central Siberia, to an average depth of 1 x. To our knowledge this is the oldest anatomically modern human genome reported to date. The MA-1 mitochondrial genome belongs to haplogroup U, which has also been found at high frequency among Upper Palaeolithic and Mesolithic European hunter-gatherers, and the Y chromosome of MA-1 is basal to modern-day western Eurasians and near the root of most Native American lineages5. Similarly, we find autosomal evidence that MA-1 is basal to modern-day western Eurasians and genetically closely related to modern-day Native Americans, with no close affinity to east Asians. This suggests that populations related to contemporary western Eurasians had a more north-easterly distribution 24,000 years ago than commonly thought. Furthermore, we estimate that 14 to 38% of Native American ancestry may originate through gene flow from this ancient population. This is likely to have occurred after the divergence of Native American ancestors from east Asian ancestors, but before the diversification of Native American populations in the New World. Gene flow from the MA-1 lineage into Native American ancestors could explain why several crania from the First Americans have been reported as bearing morphological characteristics that do not resemble those of east Asians. Sequencing of another south-central Siberian, Afontova Gora-2 dating to approximately 17,000 years ago14, revealed similar autosomal genetic signatures as MA-1, suggesting that the region was continuously occupied by humans throughout the Last Glacial Maximum. Our findings reveal that western Eurasian genetic signatures in modern-day Native Americans derive not only from post- Columbian admixture, as commonly thought, but also from a mixed ancestry of the First Americans.
There’s a wealth of molecular insights in the 100+ pages of the Supplemental Material, which I haven’t absorbed yet. But here are some representative visuals.
This is what the authors have to say about their ADMIXTURE run (p. 56):
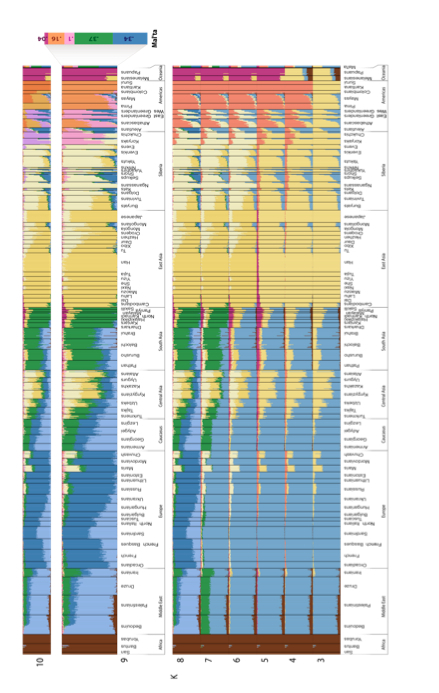
“At K = 9, MA-1 is composed of five genetic components of which the two major ones make up ca. 70% of the total. The most prominent component is shown in green and is otherwise prevalent in South Asia but does also appear in the Caucasus, Near East or even Europe. The other major genetic component (dark blue) in MA-1 is the one dominant in contemporary European populations, especially among northern and northeastern Europeans. The co-presence of the European-blue and South Asian green in MA-1 can be interpreted as admixture of the two in MA-1 or, alternatively, MA-1 could represent a proto-western Eurasian prior to the split of Europeans and South Asians. This analysis cannot differentiate between these two scenarios. Most of the remaining nearly one third of the MA-1 genome is comprised of the two genetic components that make up the Native American gene pool (orange and light pink). Importantly, MA-1 completely lacks the genetic components prevalent in extant East Asians and Siberians (shown in dark and light yellow, respectively). Based on this result, it is likely that the current Siberian genetic landscape, dominated by the genetic components depicted in light and dark yellow (Figure SI 6), was formed by secondary wave(s) of immigrants from East Asia.”
The ADMIXTURE plot clearly shows that the Mal’ta boy carries Amerindian admixture. (And not the other way around.) This Amerindian admixture comes in two types marked by ORANGE and PINK colors. Both of them are spread broadly in West and East Eurasia, albeit at decreasing frequencies from America. Athabascans, Eskimo-Aleuts and the Paleoasiatic peoples carry the PINK component at highest frequencies followed by Evens, Kets (consistently with the Dene-Yeniseian linguistic hypothesis), Selkups, Shors, Yukaghirs and Nivkhs. Just like Mal’ta, Amerindians of North and Central America carry the West Eurasian BLUE component, but paraphrasing the authors’ caveat above, the method doesn’t allow one to tell whether the West Eurasian component admixed into Amerindians or Amerindians represent a proto-Western Eurasian population. The “elephant in the room” on this plot is, of course, the sheer absence of the East Asian (YELLOW) or Siberian (LIGHT YELLOW) component in the New World at the K = 9 level of resolution. They do appear in the New World at K = 2 through K = 8 but mainly in North America. This plot yields a major blow to the “Asian origin of American Indians” idea, while leaving open the opposite process of the formation of the East Asian and Siberian components in North America.
Interestingly, the amount of Amerindian admixture in Mal’ta is higher than in modern West Eurasians, which is consistent with the following table.
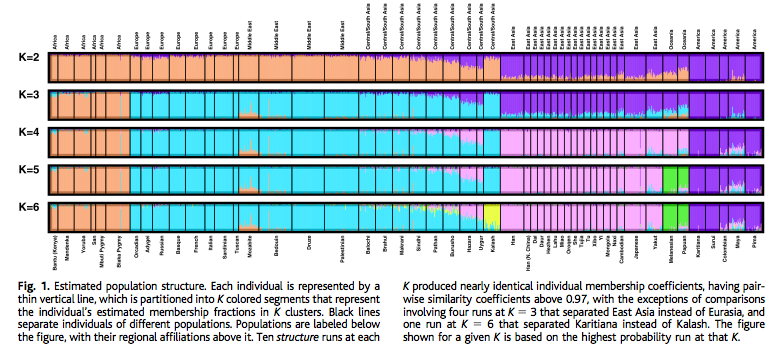
The ADMIXTURE plot above does not show a K = 2 level in which only two ancestral components are postulated. We can get a sense of what K = 2 would look like by retrieving a plot from Rosenberg et al. (“Genetic Structure of Human Populations,” Science 298 [2002], 2382). At K = 2 the world is effectively split between the Amerindian and Sub-Saharan African components.
The following PCA was presented by Eske Willerslev at the Paleoamerican Odyssey conference. It highlights the lack of a special connection between the Mal’ta sample and modern East Asians.
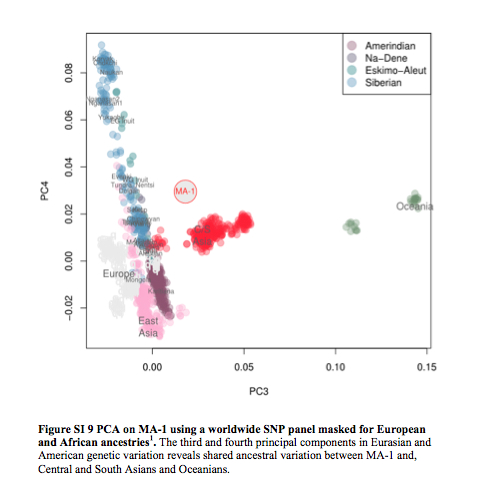
Willerslev also suggested that gene flow entered Amerindians from a Mal’ta-like population because Mal’ta is not significantly closer to East Asians than it is to Papuans, while Amerindians are proximate to East Asians. However, the actual data contradicts this conclusion (echoed by Dienekes) as, among New World groups, only Eskimo-Aleuts are significantly closer to Han than to Mal’ta (see below).
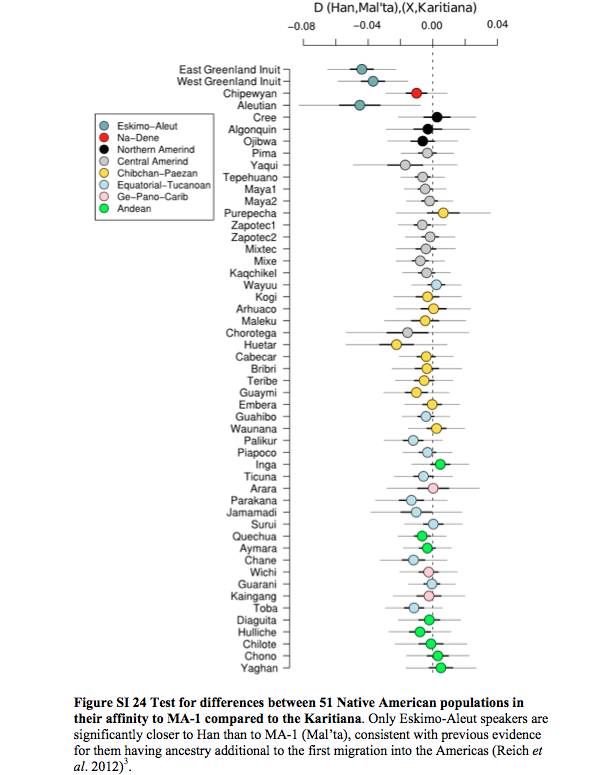
In other words (Raghavan et al. 2013, Suppl.Mat., p. 190),
“Eskimo-Aleut speakers were found to have a lower degree of shared drift with MA-1, but no statistically significant differences existed between populations designated as having 100% ‘First American’ ancestry by Reich et al. (2012).”
As Raghavan et al. write, this is consistent with previous evidence for Eskimo-Aleuts having a different ancestry component in addition to the First American component (the latter one shared with the rest of New World populations). This means that the First American component is not the East Asian component. The most parsimonious explanation for this puzzle, which Raghavan et al. (2013) conveniently or naively overlook is that both the “Amerindian” component in the Mal’ta boy and the “East Asian” component in modern East Asians originated from a subdivided ancestral gene pool somewhere in northern North America.
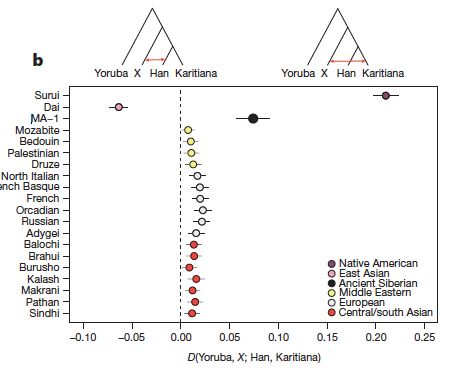
Although Raghavan et al. (2013) refuse to accept an Amerindian contribution to the Eurasian gene pool, their data adds another interesting dimension to this phenomenon. They write,
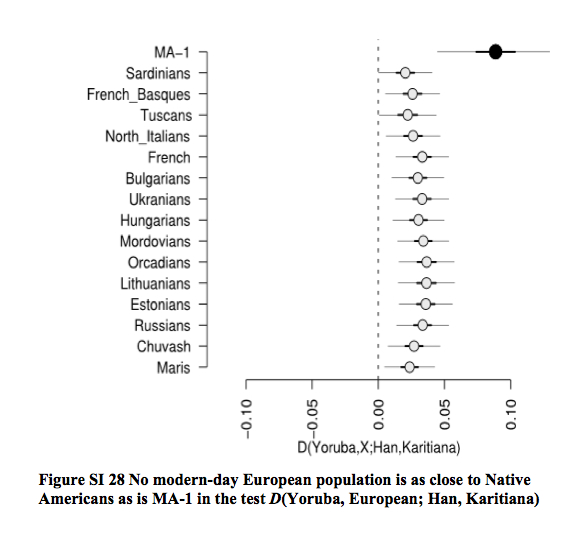
“…D-statistic tests estimated from outgroup-ascertained SNP data reveal significant evidence (Z > 3) for Middle Eastern, European, central Asian and south Asian populations being closer to Karitiana than to Han Chinese.”
As their Fig. 3b reproduced below shows, Amerindian admixture is not limited to Europe but in fact found all over Eurasia.
Now let’s look at Mal’ta mtDNA results.
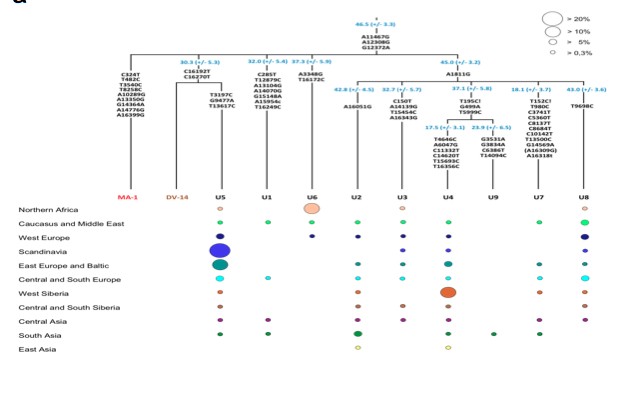
At the first glance, this fragment of the mtDNA tree looks ordinary. The Mal’ta sequence (MA-1) occupies its own clade within hg U. But what transpires if one peels the onion on it and compares all these clade and sub-clade defining mutations with the existing ancient mtDNA from extinct Eurasian hominins (Denisovans and Neandertals) is that 20%+ of these major substitutions defining the internal structure of the U clade in modern humans have exact matches with Denisovan substitutions. On MA-1 sites 13350 and 16399 are such “ancestral retentions.” The latter one is polymorphic on Denisovans, which is a rare case as Denisovan mtDNAs from the tooth and from the pinkie are nearly identical.
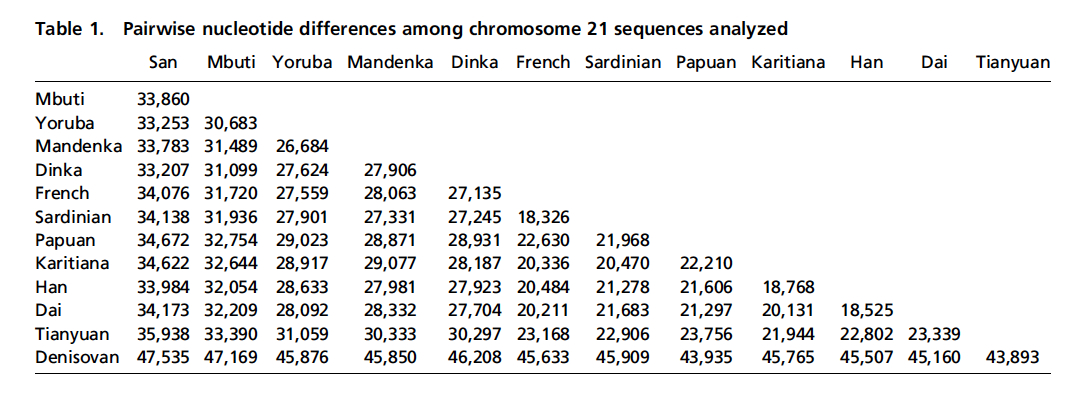
Finally, let’s compare the results of two ancient DNA studies – the Mal’ta one and the earlier Tianyuan. The latter comes from the 2013 study “DNA Analysis of an Early Modern Human from Tianyuan Cave, China,” by Fu et al. The Tianyuan specimen comes from south China, was dated at ~40,000 BP and yielded a clear molecular signature of mtDNA hg B. In very simple terms, if hg U to which the Mal’ta boy belongs is the Eurasian branch of mhg R, hg B is a major Southeast Asian and Circumpacific branch of mhg R. Raghavan et al. and Fu et al. used different methodologies and metrics to analyze the molecular material, so there’s no perfect alignment between the two. But the overall impression is that the two specimens are the two pieces from a single jigsaw puzzle that approach from different geographic angles the role of Amerindians in the formation of the Old World gene pool. Just like the Mal’ta boy likely preceded the formation of the West Eurasian gene pool, the Tianyuan individual is “ancestral to all Asian individuals studied” (Fu et al. 2013, 2225). If the Mal’ta boy was only distantly related to East Asians and was closely related to West Eurasians, the Tianyuan individual was closely related to East Asians. But both studies concluded that modern American Indians are the most genetically close population to both the Mal’ta boy and the Tianyuan individual. Fu et al. used a simple nucleotide difference count, while Raghavan et al. employed a more sophisticated measure of “shared genetic drift” (see below).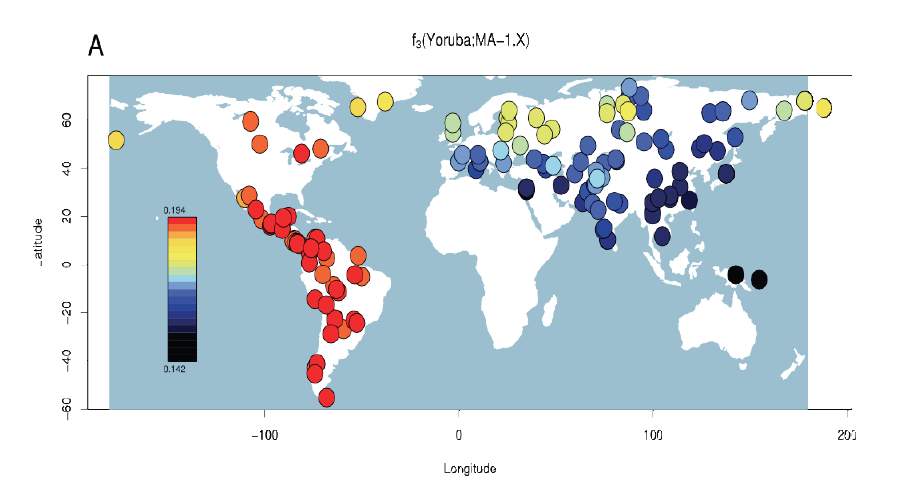


I am still reading the 110 page supplementary file myself but the Koryak and Chukchi “pink” in the Admixture plot has got to correlate with mtDNA haplogroup A and Y chromosome Q. The pink and orange are also slightly elevated in the Ket and Selkup populations. Orange might be some kind of New World mixture.
I agree. And the pink component runs deep in Eurasia, all the way to the Bedouins in North Africa. Melanesians have it too. Unless I’m color blind, which is always a possibility.
I have a 4th great grandmother we thought was Native American from East Tennessee, and we got a direct female descendant to do a mtDNA test, and it came up with mtDNA haplogroup U uncategorized. We all this was a European mtDNA haplogroup so just assumed she was not part Native American, and because our family all did atDNA tests and didn’t get any Native American. However, we all got traces of Melanesian…and now you’re saying haplogroup U could be associated with both Native American as well as Melanesian? Wow, this is making me rethink all of this now, especially after that July 2015 study linking South American Native American to Oceania. We’re all pretty much 100% European other than this, so this is the only plausible explanation for why we all got Melanesian, which literally has no admixture with other haplogroups, so hard to believe was a random fluke that showed up on all of our tests. Thanks for your post! I feel so much more enlightened now!
[…] и мезолита европейских охотников-собирателей. По мнению Германа Дзибеля, тщательный анализ митохондриального […]
Nice write up German! :)…So then the only ancestry that the Mal’ta boy shares along his maternal line with modern day mtDNA haplogroup U people is the original U defining mutation?
It shares with modern U people 3 stem mutations 11467, 12308 and 12372. Plus others, of course, that are more broadly distributed.
Okay thanks.
Maybe I am overlooking something here but did they manage to determine the mtDNA haplogroup of the Afontova Gora sample as well?
They haven’t reported it. Presumably it’s the same but no clarity on that one.
Siyo:
I am enrolled with the Echota Cherokee Tribe of Alabama.
Is the Mal’ta, male child Y DNA was hg R, brother to hg Q from P, DNA findings a confirmation that Native Americans are also western Eurasians and the Y DNA hg R is Native American origin?
How many tribes in North America have had there DNA tested? How large of a gene pool exists?
Also what about haplogroup M from Malhi et al 2007 found in 2 mid-Holocene remains in China Lake, British Columbia .How does this fit into your theory?It was also found in South America in one individual from the chachapoya mummified remains.
That’s a weird one. I checked with the Achilli team recently and they worked with the David Glenn Smith’s lab to get some of their data and apparently the latter didn’t communicate to them that M lineage that was reported from the China Lake. So they assumed that it was a fluke and the lineage was re-classified into something else.
My mother is one of the last living full-blood Washoe from Northern California/Nevada (Wel mel ti). In 2013 she had her DNA tested by the National Geographic Geno 2.0 project. Her mtDNA haplogroup came back as M. I did a web search and found only the citation mentioned by snailmail. I thought it odd that as of 2007, or rather 2013 when I did my search, there were only two reported Native Americans with haplogroup M. I assumed that this was due to either very sparse, or very unrandom, sampling that would unsqew over time. Your comment about a “fluke” being re-classified is rather disheartening.